market@chinacoalintl.com
Reinforced concrete structure is a widely used structural form in building structure, but for the detection of densely-arranged components such as beam bottom, there has been no effective method and equipment to distinguish the number of dense bars, the distance between bars and Accurate protective layer thickness. However, the inspection of these aspects of structural entities is an essential parameter for evaluating the durability of components. Therefore, after years of research and practice, the author of this article has developed a new method for detecting dense bars, and successfully applied it to actual testing instruments, breaking the bottleneck of dense steel bars measurement by rebar detector instruments. The measurement level of this type of non-destructive testing equipment has been improved, and it has provided a technical testing basis for promoting the acceptance of concrete structure engineering and operation and maintenance.
1 Introduction
Reinforced concrete structure is a widely adopted structural form in building structures. Reinforced concrete has a higher tensile strength. Concrete has a higher compressive strength; the synergistic effect of the two can well bear the load on the structure. Fully bear the tensile stress generated in the structure, and its ability to withstand the tensile stress mainly depends on the reinforcement ratio and the thickness of the protective layer of the steel bar. At the same time, the thickness of the protective layer has a great influence on the durability of the structure. Therefore, it is very important to detect the number, spacing, diameter and thickness of the protective layer in the structural entity.
At present, the rebar detector used for detection is mainly realized by the electromagnetic induction method. However, due to the relatively simple sensor structure design and detection signal analysis and processing methods of existing instruments, it is difficult to accurately distinguish each steel bar and the thickness of its protective layer cannot be accurately measured in the case of densely distributed steel bars. The main load-bearing member-the beam, the design of the main tensile reinforcement at the bottom of the beam is generally dense, and the offset during construction often causes the net spacing of the main reinforcement at the bottom of the beam to be less than 1.5 times the diameter of the reinforcement. In this case, the previous reinforcement Detectors often have "missing bars" or "misjudgments", so the detection of the main ribs at the bottom of the beam, especially the main ribs at the bottom of the existing engineering beams, often becomes a problem that troubles the inspectors. The rib arrangement is analyzed and researched. By improving the sensor structure design and detection signal analysis and processing methods, the instrument's ability to distinguish dense steel bars is improved.
2. Problems in the detection of dense steel bars in existing concrete structures
At present, the reabr detectors at home and abroad mainly use the electromagnetic induction method. As shown in the component model shown in Figure 1, when the net spacing S of the steel bars is small, as the thickness of the protective layer increases, the induced magnetic fields between the steel bars will superimpose each other and affect each other, resulting in inaccurate measurement results. When the net spacing S of the steel bars is less than 1.5 times the diameter of the steel bar, and the thickness C of the protective layer is greater than 2 times the spacing S, it is difficult for general steel bar measuring instruments to accurately distinguish the two bars and their corresponding positions as shown in the figure.
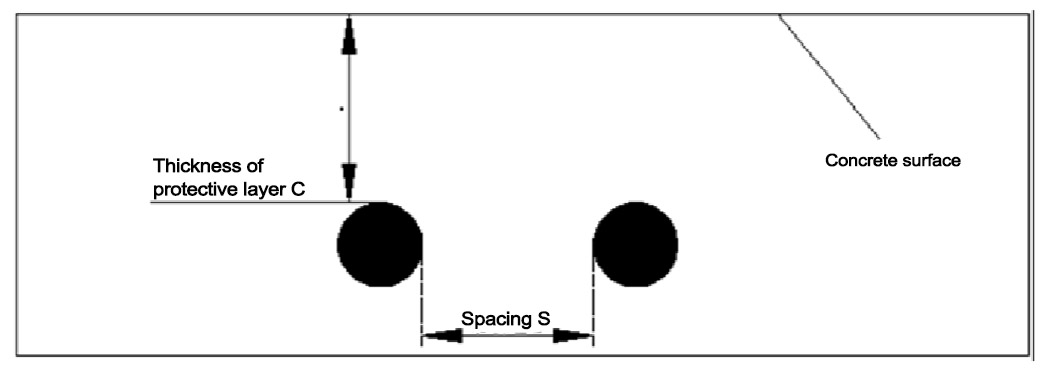
Figure 1 Reinforced concrete components
3. Electromagnetic induction method for judging the single rib
The steel bar parameters are determined by measuring the strength of the induced electric field of the steel bar in the electromagnetic field. When the steel bar diameter is fixed, the strength of the induced signal in the magnetic field corresponds to the distance between the steel bar and the sensor. When the sensor is directly above the steel bar, the distance is the smallest and the signal value is the largest (see Figure 2).
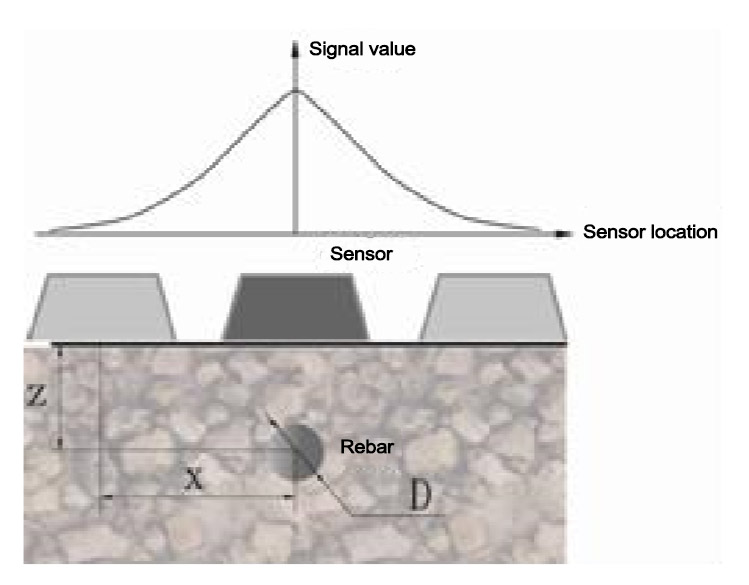
Figure 2 Measurement signal curve
The traditional sensors are mostly simple in structure, a combination of one or two coils. If the coil area is small, the resolution of dense ribs will be higher, and the measurement accuracy of the thickness of the protective layer will be higher, but the detection depth (thickness of the protective layer) is shallow; on the contrary, if the coil area is large, although it is improved The measurement of depth but the resolution of dense tendons is greatly compromised. The reason for this problem is that each steel bar has its own induced magnetic field. As the distance between the steel bars decreases, the induced magnetic field between the steel bars will superimpose signals, as shown in Figures 3 and 4.
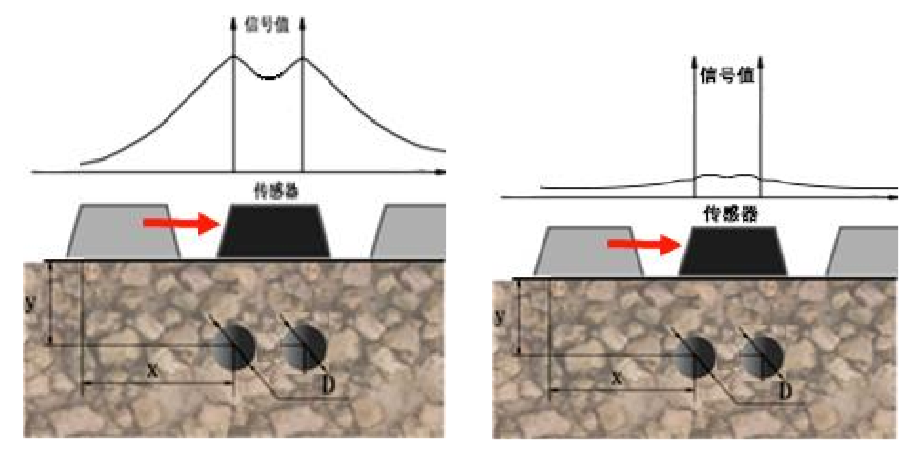
Figure 3 Schematic diagram of dense rib measurement Left A Right B
In view of the denser steel bar arrangement, in theory, the smaller the area of the sensor coil, the smaller the magnetic field coverage area, the more targeted, the better the effect of resolving the steel bar within a certain thickness range (according to empirical testing, the coil The area of is preferably smaller than the diameter of the measured steel bar). However, when the coil is small to a certain degree, as the thickness increases, the induced signal becomes weaker and weaker. As shown in Figure 3- (b), the sensor's ability to test the protective layer is obviously insufficient, and it will still lead to the inability to distinguish the reinforcement Accurate location and quantity. At the same time, due to the inherent shortcomings of the sensor structure itself, its calculation and analysis methods are also subject to great limitations. The above comprehensive factors have led to the failure to solve the problem of measuring dense ribs.
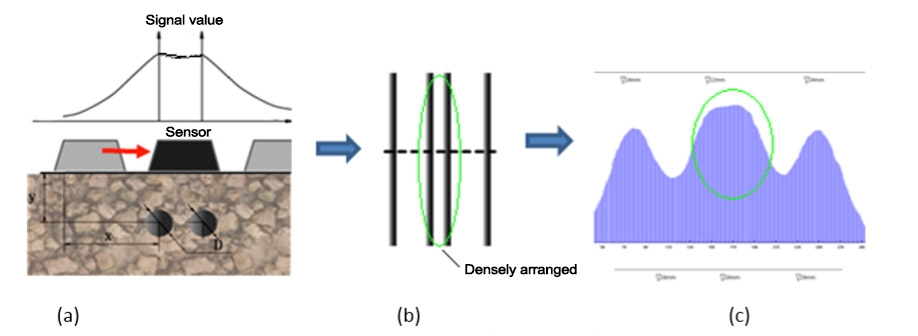
Figure 4 Schematic diagram of measurement of unevenly arranged dense ribs
4. Research on methods to improve the ability to distinguish dense steel bars
In response to the aforementioned problems, we have improved the sensor structure and developed a new measurement and analysis method. The structure of the sensor is improved to facilitate the generation of magnetic fields of different strengths and ranges and to obtain the measurement signal when the current magnetic field strength is established, thereby establishing a data model and participating in analysis and calculation. The new measurement method is to use the results of this improved sensor structure. After analysis and a large number of mathematical calculations, the final measurement results are obtained, that is, the number of steel bars, the spacing, and the thickness of the protective layer. See below for details.
4.1 Improve the internal structure of the sensor,
It becomes a composite sensor. The composite sensor is composed of multiple sensors (the composite sensor has been patented by Shandong China Coal Group. The internal structure of its series of products is shown in Figures 5 ~ 8.
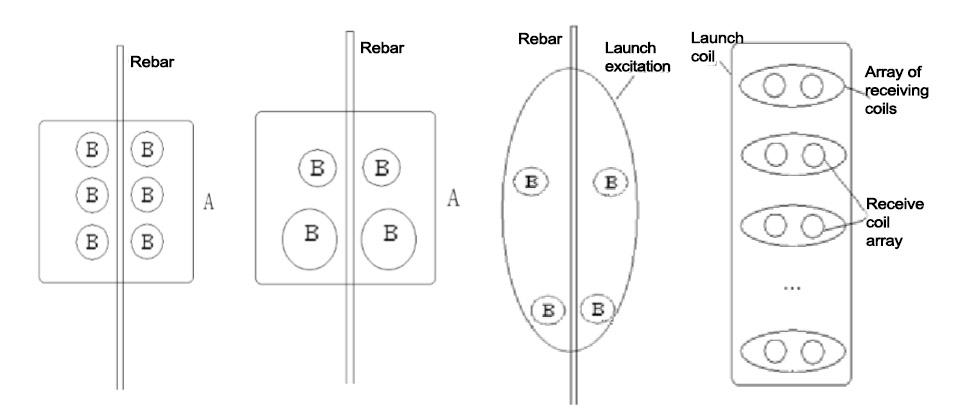
Figure 5 Sensor structure 1 Figure 6 Sensor structure 2 Figure 7 Sensor structure 3 Figure 8 Sensor structure 4
According to the foregoing analysis, our requirement for the coil in the sensor is to reduce its size as much as possible without wishing to reduce its detection capability. Therefore, this kind of composite coil meets this requirement. Its basic principle is to transform the original coil into a combination of N small coils, which reduces the area of each coil and increases the overall test capability of the sensor. The N groups of coils with different shapes and different functions in the sensor are measured according to different depths, and the corresponding combination is started by the software control with the hardware circuit. In the figure, A and B refer to coils with different size specifications. As can be seen from the figure, the larger A coil size can contain several small B coils.
4.2 Research on new algorithms.
4.2.1 The method of judging the number of dense tendons
As the thickness of the protective layer increases, its induced signal value changes accordingly, and has a certain functional relationship. The signal shape is shown in Figure 9.
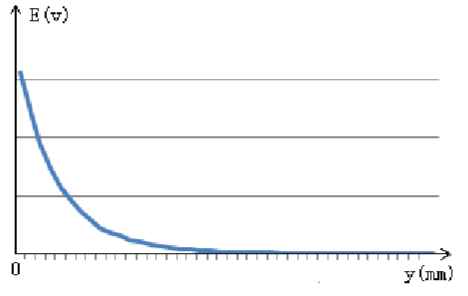
Figure 9 The relationship between the induced signal of a single steel bar and the thickness of the protective layer
The relationship between the energy value of a single steel bar and the thickness of the protective layer
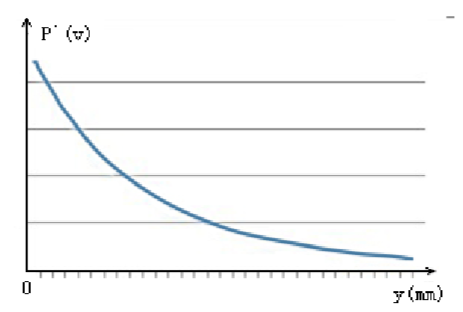
Figure 10 The relationship between the energy value of a single steel bar and the thickness of the protective layer
That is, E = f [D, y,] (1) where E is the test signal value; D is the diameter of the steel bar; y is the vertical distance from the sensor to the surface of the steel bar, that is, the thickness of the protective layer.
The curve of the induced signal of a single steel bar and the change of the position of the sensor relative to the steel bar is shown in Figure 2. The function corresponding to this curve is E` = [D, y, s] (2) where E` is the measured real-time signal value; s is the sensor displacement value;
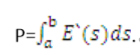
When D and y are known, integrate the determined curve E`, calculate the area occupied by its signal curve, and use it to represent the energy value:
D is still known, and as the thickness of the protective layer y varies, so does P. Then the function P` = f [y, p]; the function form is shown in Figure 4.
Then, we adjust the P` function corresponding to different D, and the final function is P` = f [y, p, l, m….]; Where l, m… etc. Are all correction coefficients. The relationship between diameter, thickness and energy is now basically clear.
The reason for the introduction of this energy design idea is that: theoretically, from the point of view of energy conservation, the curve of a single steel bar at a certain thickness (see Figure 2) it generates energy of P`1; two under the thickness When reinforcing steel (its curve is shown in Figure 3), the energy is P`2, and P`2 is twice that of P`1; when there are three reinforcing bars, the energy P`3 should be three times that of P1, and so on. Of course, we also found in the experiment that when the steel bars are close to each other, due to the great influence on each other, sometimes the measured energy multiple relationship can only be close to an integer multiple, not a very accurate multiple relationship. Therefore, we start from the software algorithm The above adjustments were made, and a large amount of experimental data was used to make an actual measured energy standard table for reference.
However, when the number of steel bars is large and the arrangement is very dense, even if there are formulas and data tables, due to the complexity of the scene, the number of steel bars calculated by the energy algorithm may sometimes fall between the two situations. For example, if the calculated number of steel bars is 4.2, then it may be 4 or 5 or 6 (although the probability is small but there are still). At this time, we need to make a decision with the help of a judgment condition. This condition parameter is the center distance of the coils inside the sensor, that is, the signal changes scanned by each coil at the same time and their positional relationship participate in the judgment to obtain The final number of bars. For example, when the designed steel bar diameter is 10 mm, and the center distance of a group of coils in the internal sensor is 36, the measured signal curve is shown in Figure 4 (c). The intermediate signal is very strong and the span is very wide, but it is not resolved. Outstanding peak and valley values. At this time, you can start the coil combination of other pitches to judge further, and finally combine with the corresponding algorithm analysis to get the final result.
4.2.2 Determine the location of the reinforcement:
According to 4.1.2, after calculating the number of steel bars, calculate the position of the steel bars according to the energy. As shown in Figure 2 and Figure 3, the specific position of the steel bar is theoretically at the peak point of the curve, that is, half of the energy value. We know the total number of rebars and total energy in the current extremely dense situation. To find the qualified position is the position of the rebar according to the principle of half the unit energy. Of course, if actually calculated, parameters such as sensor coil center distance, energy correction table, etc. need to be introduced to jointly participate in the judgment.
4.2.3 Other ways to judge the number and position of dense tendons (image judgment method)
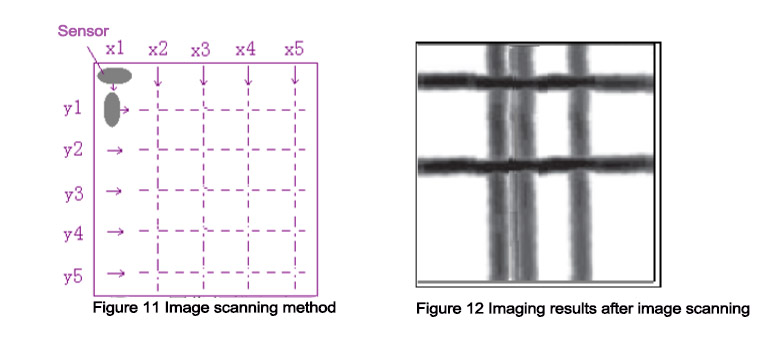
In addition to the analysis method of dense ribs introduced above, a more intuitive and simple method can be used to judge the existence of dense rib sets in individual cases. For example, in actual engineering, the arrangement of steel bars during design is generally uniform and the distance between them is large, which is very easy to measure. However, due to artificial reinforcement, cast-in-place and other reasons during the construction process, the steel bars will be displaced, resulting in a dense comb in Figure 4. If the instrument has the sensor structure shown in Figure 8 (that is, multiple sets of coil sensors), multiple coils work at the same time, and a full area scan can be performed for a certain component area (see Figure 11). Then all the signal values of this area are imaged through stitching and displayed on the screen intuitively, as shown in Figure 12. From the figure, it is known that the pixels occupied by a single steel bar (that is, the thickness of the steel bar), when the two bars are densely arranged and difficult to distinguish, we can also reasonably determine the number and location of the steel bars from the figure. Although this method is simple, it has limitations in the occasion of use, and the rebar detector needs to have an imaging function.
How to determine the number and location of dense tendons
5. Tests and results
The above method for judging dense ribs has been implemented in the ZBL-R660 integrated rebar detector of Shandong China Coal Group, and the test results are more obvious. And has been used in many engineering examples. Examples:
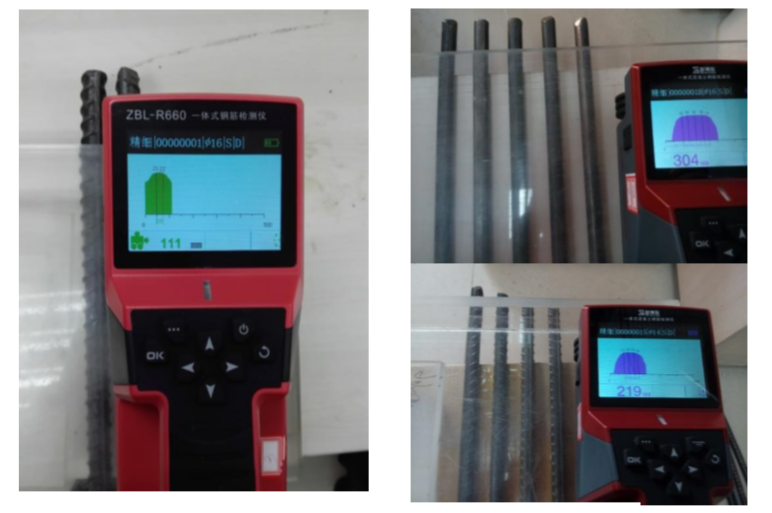

Figure 13 Example of detection of dense tendons
Example data of dense tendon detection
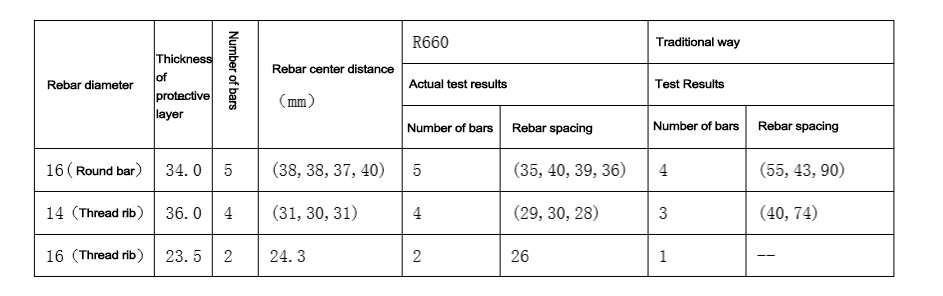
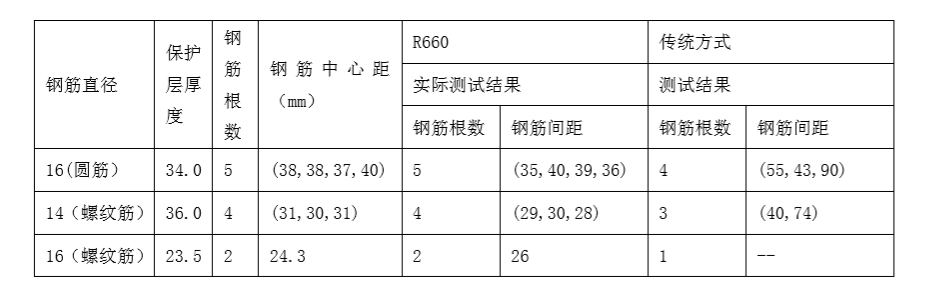
Table 1: measured data for the example in Figure 13
6. Conclusion
Based on the study of dense bars, by redesigning the sensor structure and studying the corresponding algorithm, we have developed an electromagnetic induction method with strong resolving power for dense bars, and it has been implemented in ZBL-R660 rebar detector , and the test results It is good and has been verified in actual engineering inspections throughout the country. Although this method has made a great breakthrough compared with the traditional method. However, it is still as if the amount of calculation is large. In the case of a long-distance arrangement of different depths and very dense, there may still be deviations in the test. We also hope to continue research and improvement in the following work, and continue to make our own contribution to the industry of non-destructive testing.

© Shandong China Coal Group. © 2017
Address: No. 11, North of Kaiyuan Road, High-tech Zone, Jining City, Shandong Province, China
sales@chinacoalintl.com
Executive Editor: Zhang Wen / Editor: Linda Zhang