market@chinacoalintl.com
The bipolar profile in the automatic image-forming water detector of the sky-electric geophysical survey is an equivalent color map separated by several contour lines, which is colorful and colorful. People often ask, what do different colors mean? Which color represents water? Answering this question needs to start from the beginning.
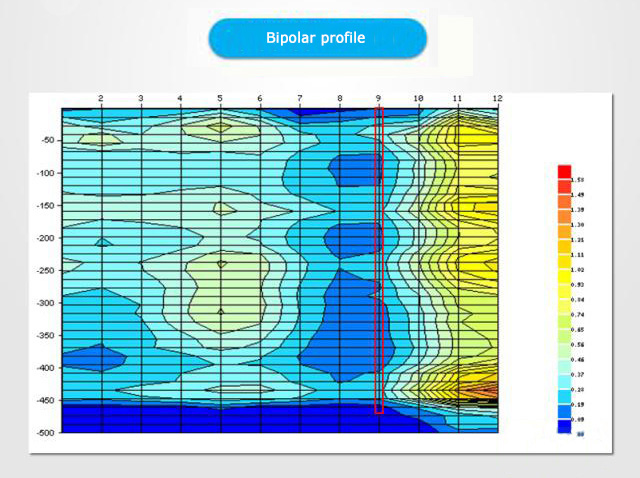
1. There is a row of color bars (also called value bars) on the right side of the profile view, and the top is red. From top to bottom, it is divided into 18 blocks according to the order of red orange, yellow, green, blue and blue, next to each block. Marked with numbers, the number indicates that this color represents the potential difference of this interval, the number marked on the top line represents the maximum value of the potential difference of the figure, and 18 color blocks divide the maximum value into 17 According to this, the upper limit and the lower line of the potential difference represented by each color block can be calculated. If the maximum value is 2.30, 2.30/17 = 0.14, the potential difference represented by the bottom dark blue block is 0.00~0.14, and the second block by the analogy is 0.14~0.28. The value of each color block is It is calculated like this.
2. As can be seen from the above, the values represented by the respective patches are determined by the maximum value in the graph. When the same line is repeatedly measured, if the maximum value changes due to the change of the intensity of the signal source or the occurrence of interference, the values represented by the patches are also adjusted. When the maximum value increases a lot, the values of other measuring points change in the direction of blue, and more blue appears, although there is no change. When the high value is lowered on the computer, these points will change in the direction of red. It can be seen from this that the question of what color is proposed for water is not true.
3. In the same figure, the color and value indirectly reflect the size of the rock resistivity, that is, the difference in the conductivity of the rock. The closer to the red conductivity, the better the conductivity is closer to blue. There are many factors that affect the conductivity of rocks. The closer to red, the harder the rock, or the better the water quality, or the less conductive minerals, or the smaller the fracture rate. The closer to blue, the opposite is true. Below we change the value from small to large to the direction of reddish, and vice versa. The more the factors affecting the conductivity of rocks, the more explanations are available. This is the multiplicity and complexity of electrical exploration.
4. The types and mineral composition of rocks vary widely, and the lithology is different in depth. Therefore, in the figure, neither is the redder, the better, and the blue is better. The principle of finding water is to be in the horizontal direction. Look for mutations, look for big changes from small to small, find blue in reddish, find reddish in blue. This is what is commonly called anomaly. The anomalies mentioned here include both abnormal changes in color and abnormal changes in contours, such as sudden changes in the density of the contours, or jagged, broken lines, V-shaped, inverted V. Shapes such as glyphs. Observing anomalies should be based on horizontal observation, supplemented by longitudinal observation, with the original map 0 gain measurement as the main image, and the processing map as the auxiliary (retest map can only see the contour, and the color and value can not be paid too much attention) .
5. The structure can control water, the lithology can also control water, and the brittle-hard rock has a higher well-forming rate than the soft rock. Some people call it lithology water control theory. In the figure, the larger the range of bluishness (and the value of the color block), the greater the possibility that the lithology is not good, the lithology is not good, the crack is not developed, and the water is not good. If the range of bluishness in the reddish-based map is local, such as a small cluster shape, a narrow column shape, or a thin layer that alternates with each other, the possibility of lithological mutation is much smaller. And the probability of an increase in the fracture rate is much greater.
6. It is also common to find a well location in a reddish area in a blue-based map. For example, find gneiss in rocks dominated by schist, find glutenite in rocks dominated by mudstones, and find marbles in rocks dominated by amphibolites. Look for a reddish area. These reddish areas have good lithology and the cracks will be more developed. At this time, the positive increment of the lithological logarithmic value greatly obscures the negative increment of the influence of the crack on the numerical value, so it is better to select the well in the reddish area in this case.
7. What color is the boulder layer of the Quaternary in the upper part of the figure? This depends on whether the Quaternary underburden is high or low. If it is under the mudstone of very low value, the layer of gravel is reddish, and the sand is found to be a shallow well with a reddish thickness and a deep color. It should be noted that this situation may be much larger than the actual depth due to the lower layer of the high-value layer. This is similar to the situation in a stratum of thick mudstone under strong weathered basalt. If the gravel layer is under high-resistance rock, the sand-gravel layer tends to be blue and not easily recognizable due to the large porosity of the sand layer.
8. What is the problem with the numerical value of the top red color patch in the color bar? This value is the maximum value in this map, which is an indirect reflection of the resistivity of the rock, which is a positive correlation. The maximum value will also increase as the line approaches the high voltage line. The larger the maximum value, the larger the value of each color block becomes. Even the value of the blue color block becomes larger, so you can't just look at the color of the image, but also the value of its value. The maximum number of flying points is caused by interference and must be distinguished. The size of the rock resistivity is mainly determined by two aspects in the figure. First, the resistivity of the rock skeleton is mainly related to the mineral composition. The second is the size of the resistivity of the water contained in the voids or cracks of the skeleton. The less the minerals in the water, the greater the resistivity, and the true chemically pure water is not electrically conductive. The resistivity of spring water is several times larger than that of ordinary tap water. In addition, the mineral composition, weathering degree and electromagnetic interference of rock are different. Therefore, the maximum value in the cross-section diagram can be theoretically large, without interference. It is normal to reach dozens of cases, and the values measured by instruments produced by different manufacturers are also different. In the case of Pucci, the maximum value reached 222, and the water volume is still very good, which is very telling the problem. The numerical value is not directly related to the absence of water. In the limestone formation, because the hardness of the water is too large, the values are mostly small, mainly due to the minerality in the water or the high fracture rate or even the mud joint. It should also be noted that the difference between the value measured by the antenna and the potential measured by the artificial field is not a concept and is not comparable.
9. What is the reason for the white color in the picture? The white indicates that the measured value is 0, and the color next to the 0 value is generally the lowermost dark blue in the color bar. The number marked in this dark blue is 0.00~××, which can be considered as the same as the dark blue at the bottom. In a color area, a value of 0 is mostly normal. The presence of white areas does not affect other areas. If the retest 0 value disappears, but it is still in the dark blue area, it is normal. It is not uncommon for a graph with a value of 0 to produce good water. The amount of water is independent of zero.
10. How do the black diamond blocks in the figure explain? In the section view, you will often see small diamonds or triangles with black borders. Such points on the graph are undoubtedly discrete points with particularly high values. These points can be called flying points because they fly away from the normal range of the curve. The cause of the flying point is the result of unexplained interference, which often disappears or shifts during the retest. Some of the maps have not been retested to produce water with such a flying point. This is just a coincidence, and there is little possibility of water coming out near the depth of the flying spot. The flying point has a black edge because its value is too high, and the contours drawn along its periphery are very dense, so it becomes black, just like when the terrain contour is drawn, the situation is the same. . The black horizontal bands in the figure are also caused by sudden changes in values. The value of the flying point with the black border does not affect the value and color of the points outside the black box. It does not need to be deleted, and does not affect the analysis of the picture. However, the maps with more flying points indicate that there are more disturbances. Most of the star-shaped points without black edges are also caused by interference. Whether the values are reliable or not is worth considering.
11. The distribution of the blue zone and the red zone in the figure is also a common pattern. The upper part of the figure is blue in color and has a large thickness. There is no obvious information, only the lower part is reddish, but the depth is large. This situation does not mean that the upper part must be waterless, but it is more difficult to analyze. This kind of picture can be considered from the following three aspects:
First, it depends on the value of the color block corresponding to the blue area. If the value is small, and there is no known well data comparison, it is better to give up the alternative line. Second, if the value is not very small, and it is a crystalline rock, a relatively high value point can be determined from the treatment map, and the well is drilled in a location where the lithology in the weathered layer is more brittle.
Third, if the lower reddish area has an abnormality such as a V-shaped shape that can stand up and down, it can be considered that it is formed by the upper part and can be fixed. Although it is not directly displayed in the upper blue area, there is The possibility of water is great.

© Shandong China Coal Group. © 2017
Address: No. 11, North of Kaiyuan Road, High-tech Zone, Jining City, Shandong Province, China
sales@chinacoalintl.com
Executive Editor: Zhang Wen / Editor: Linda Zhang